All / Experience Design @ Van Art Gallery

Experience Design @ Van Art Gallery

An AI-art installation made for the 2022 Imitation Game exhibit at the Vancouver Art Gallery, where the visitors became the artwork.
The installation in use: two screens on a dark wall, one showing colour fields, the other the drawn line

Ask

Vancouver Art Gallery's 2022 exhibit, named Imitation Game, explored the transformative influence of AI on the development and production of visual culture. My team was approached by the gallery's head curators to design, develop, and implement an installation. They wanted:

  • A functional art piece that could be implemented in the Imitation Game exhibit
  • Non-invasive data gathering method that does not impede visitor's experience
  • Attractive and "accurate-ish" visualization output of visitor data

Highlight/s

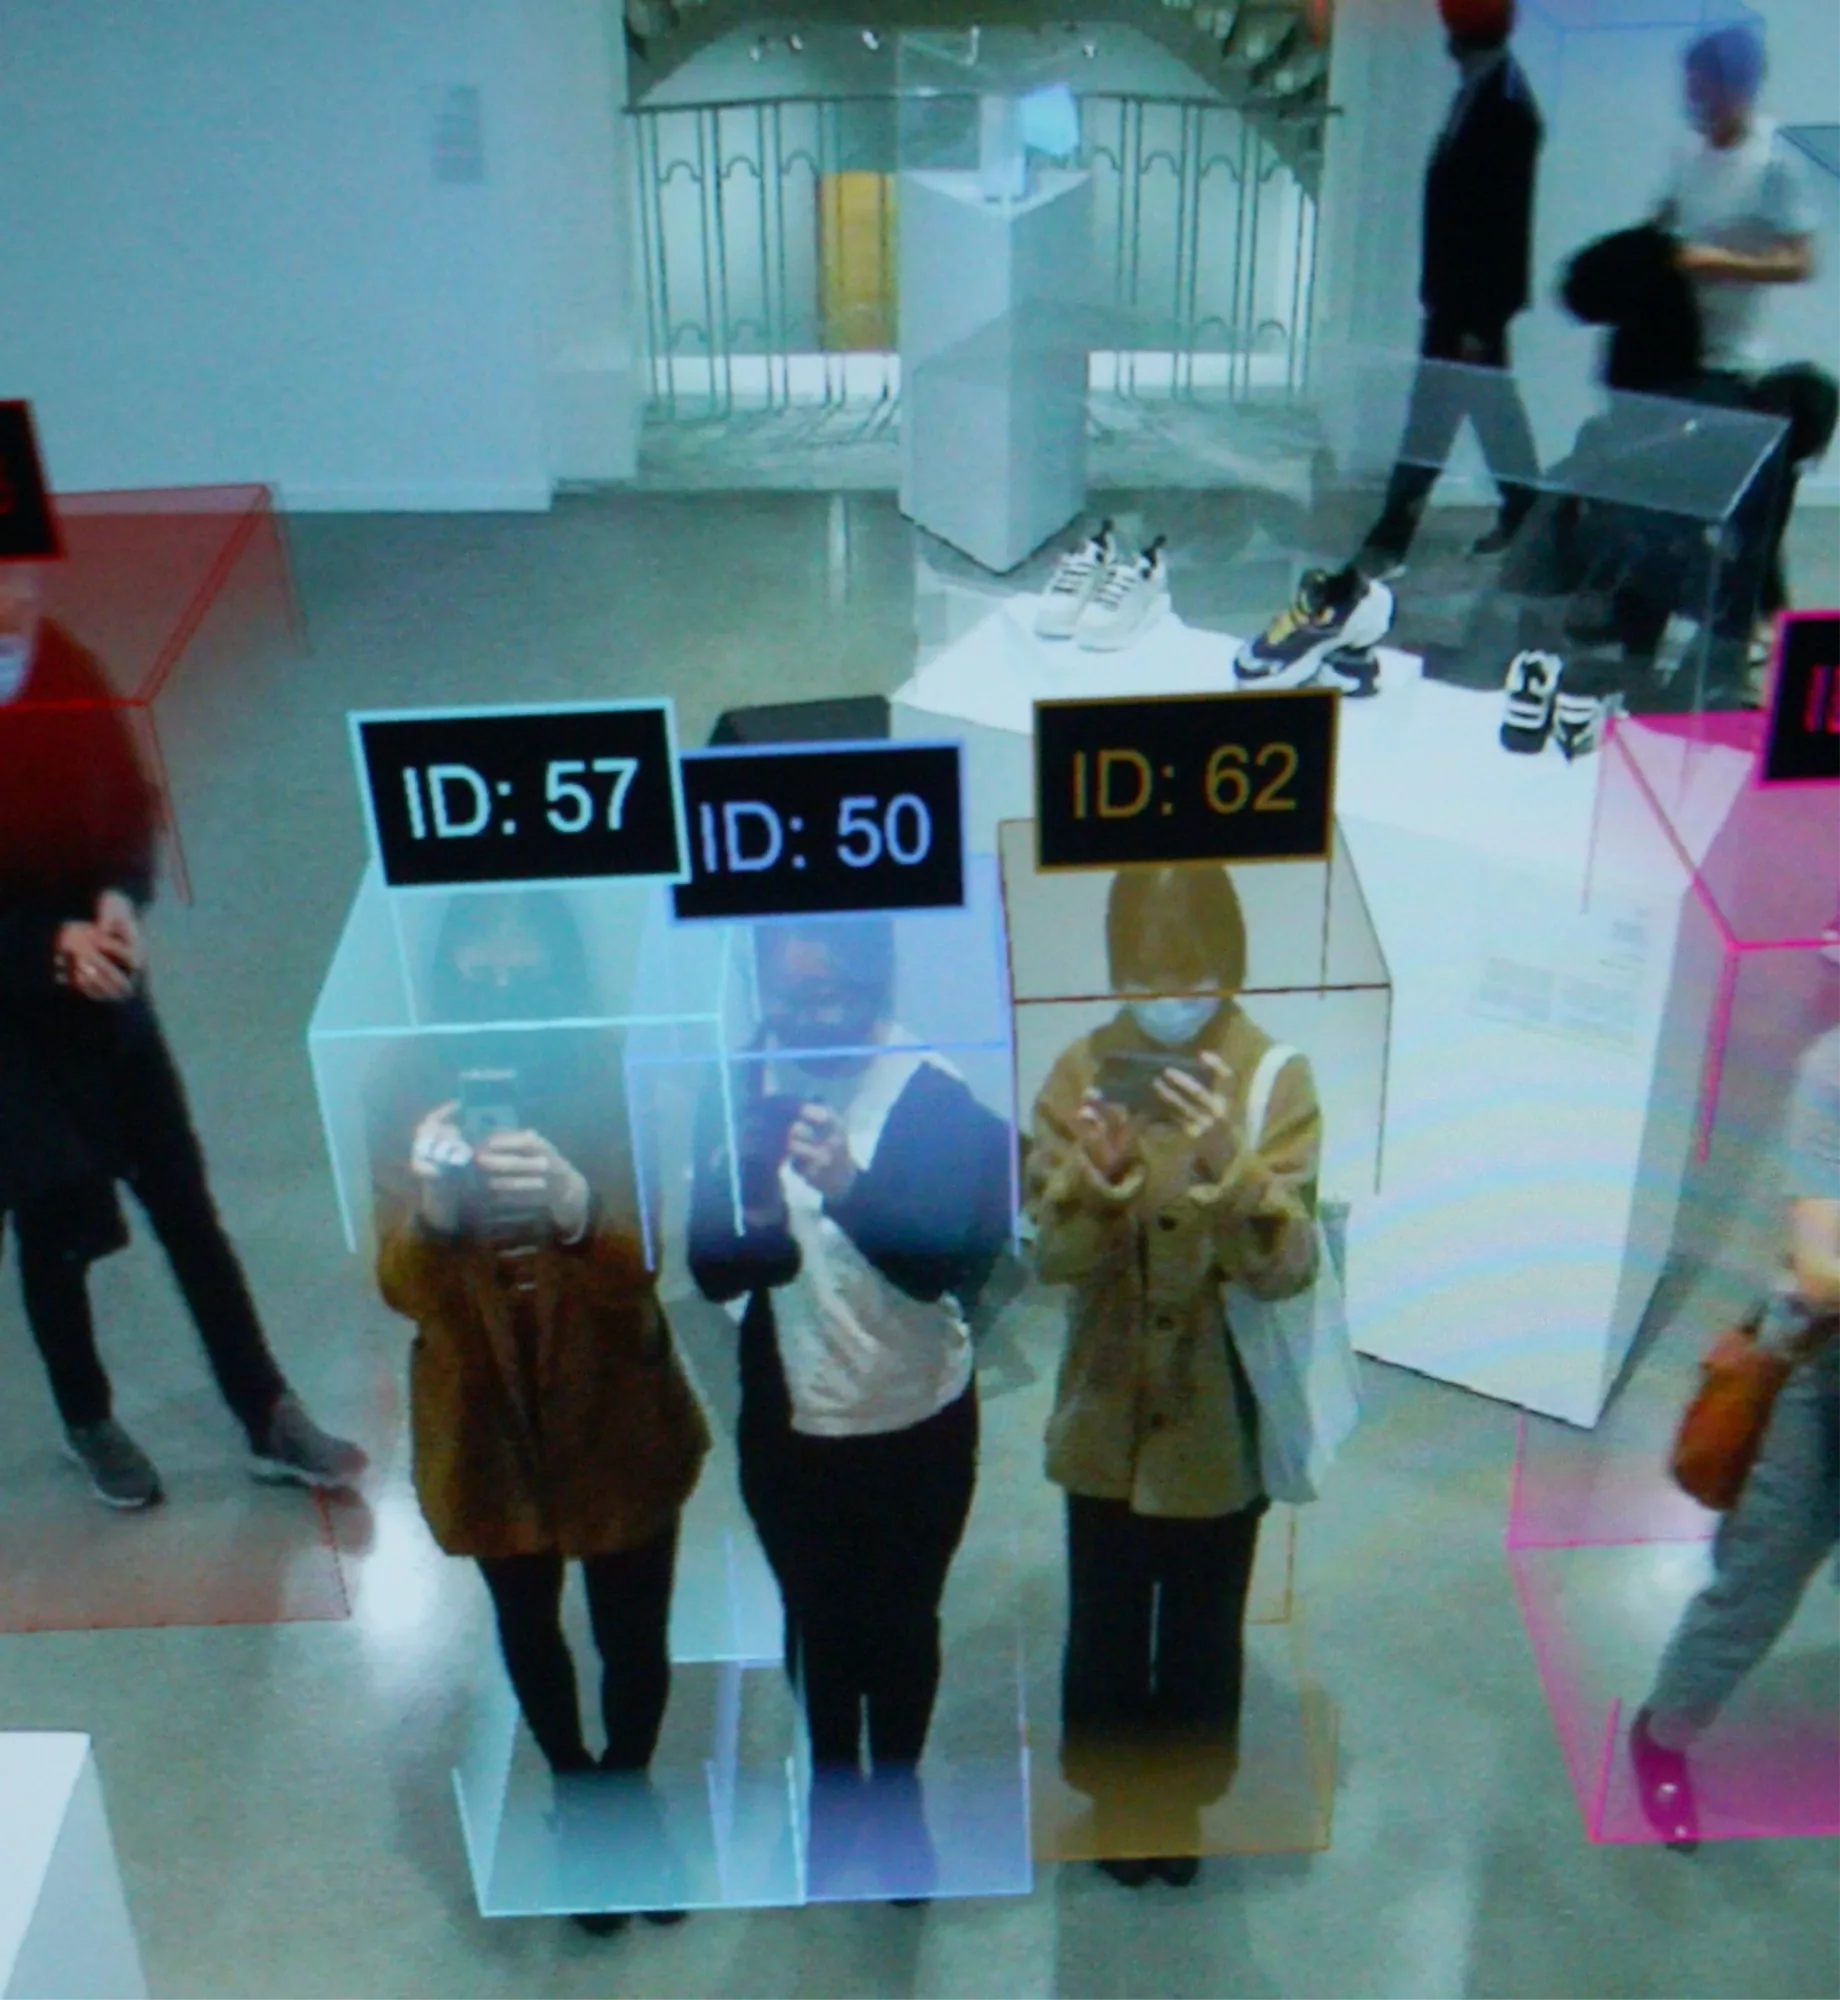
We worked on my idea, which was to use real-time human-detection software to track each visitor as an anonymized numbered, coloured path, plotting movement and "dwell time" live on a nearby monitor as it happened. Turning visitor behaviour into an immediate, visible pattern let the installation double as both artwork and research tool, fitting naturally into an exhibition about AI itself: the visitors became the artists.

Contribution

  • Designed core visual system translating visitor movement into real-time generative output (and named it: 'Creepers')
  • Defined the balance between unobtrusive data capture and meaningful visual feedback within an exhibition context
  • Developed the visual language and rules governing how movement data was represented in the installation and the customization tool we also supplied
  • Worked on the didactic panel content and the visual design system / assets which informed the app for the installation
  • Mapped the full visitor journey and exhibition layout for the installation space based on the user personas and journeys

Outcome

The aim of Creepers was to be understood by all gallery visitors in any capacity, regardless of background. We wanted visitor data to be presented in an aesthetically pleasing way, so viewers could appreciate it regardless of the deeper meaning.

Metrics

~830 average visitors per day
across the run
8 months in the exhibit
1 Award: Gerri Sinclair for
Innovation in Digital Media

Exhibited as part of The Imitation Game: Visual Culture in the Age of Artificial Intelligence at the Vancouver Art Gallery in 2022, and awarded at the Centre for Digital Media.

Project media

Here are some key artefacts from the project, with captions explaining each of them.
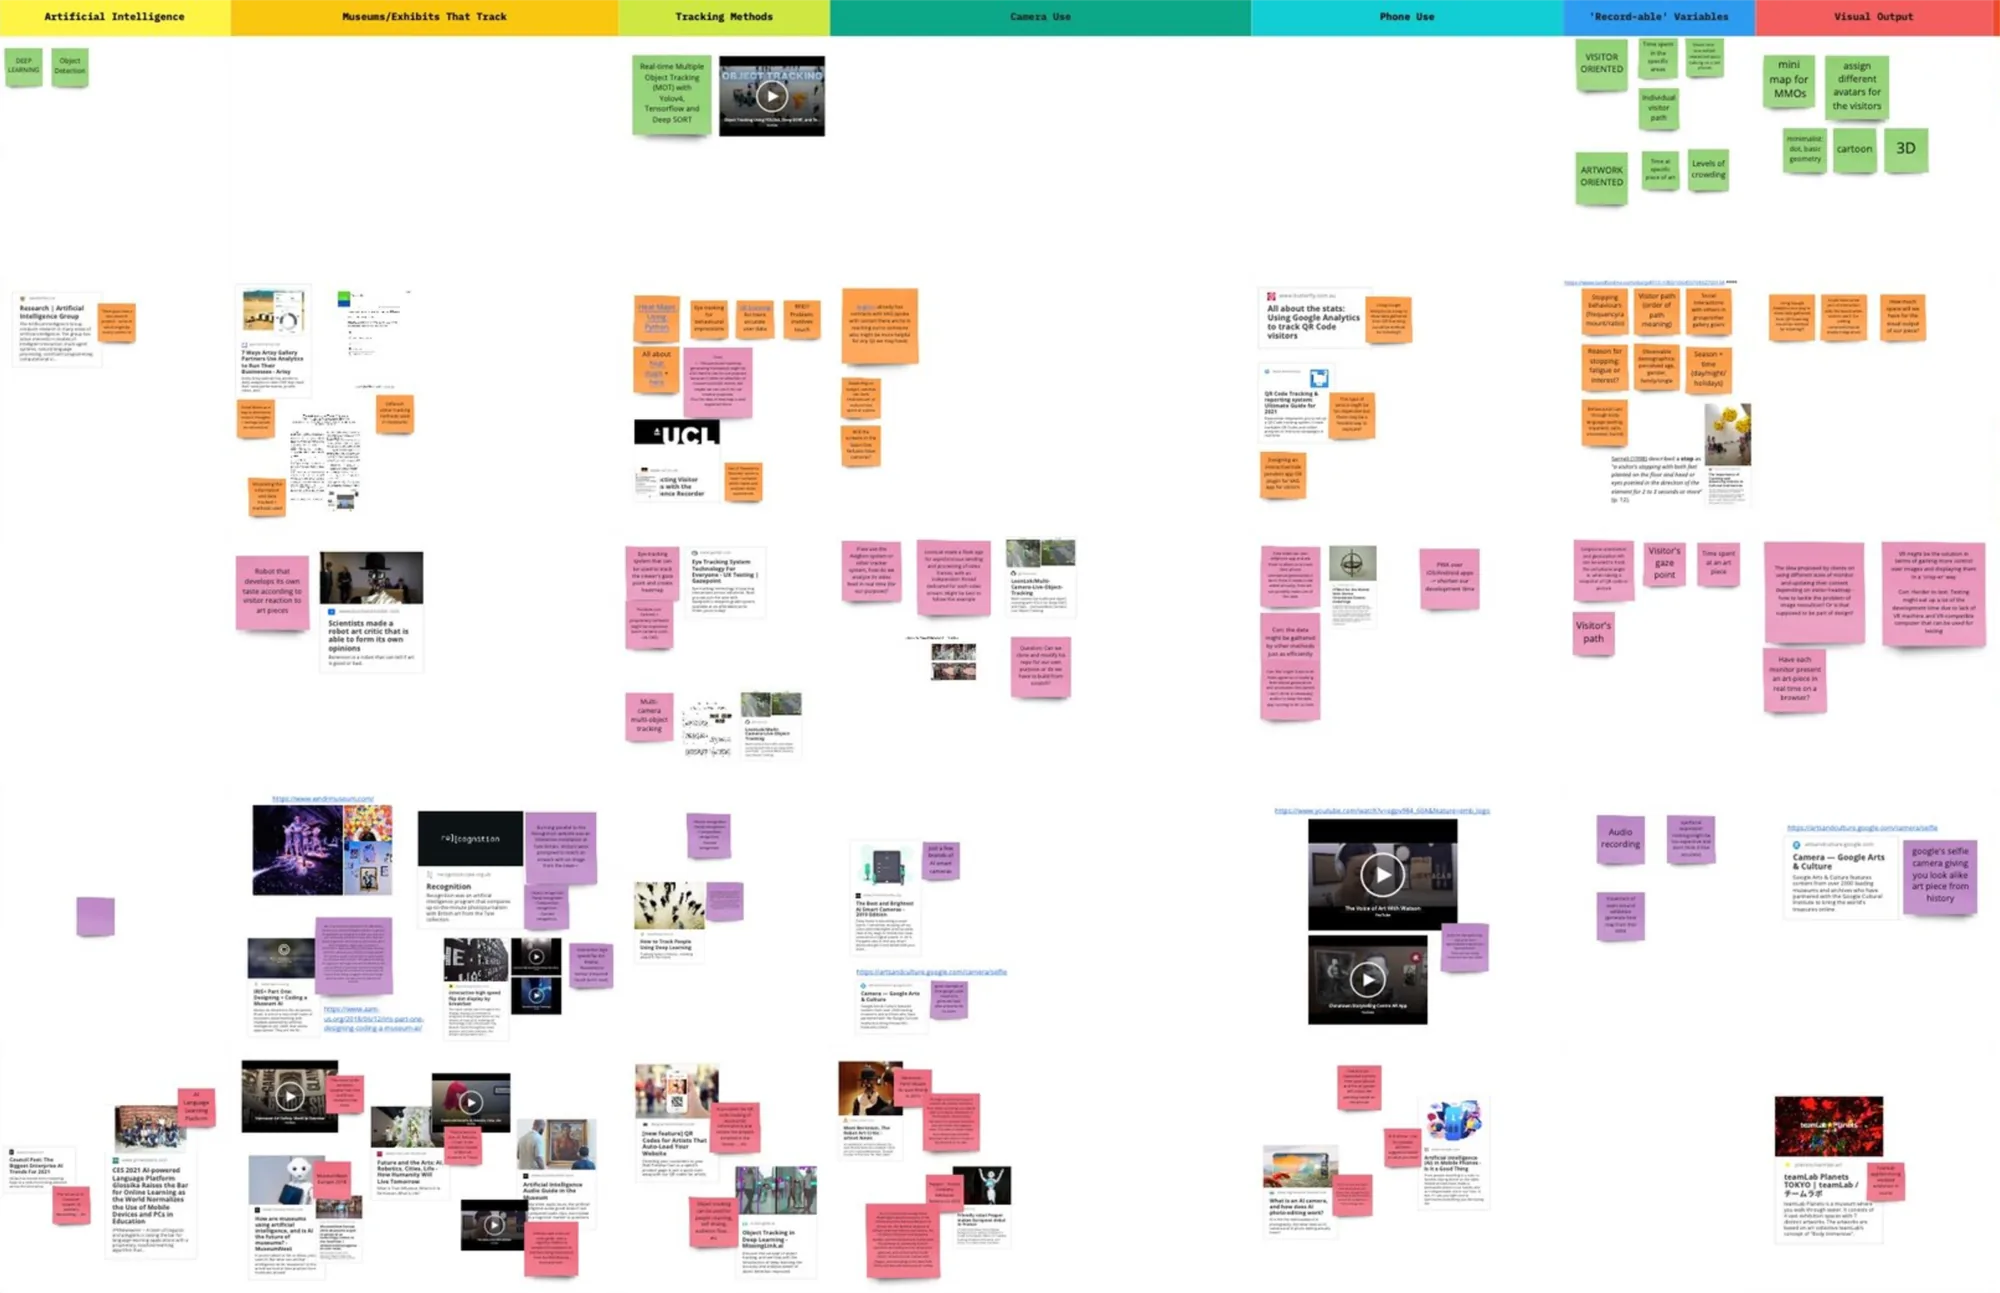
Research synthesis board in Miro, with every source sorted into themes
The synthesis board. I read a lot for this one and needed somewhere for it all to land, so every source got sorted into themes rather than left as a pile of open tabs.
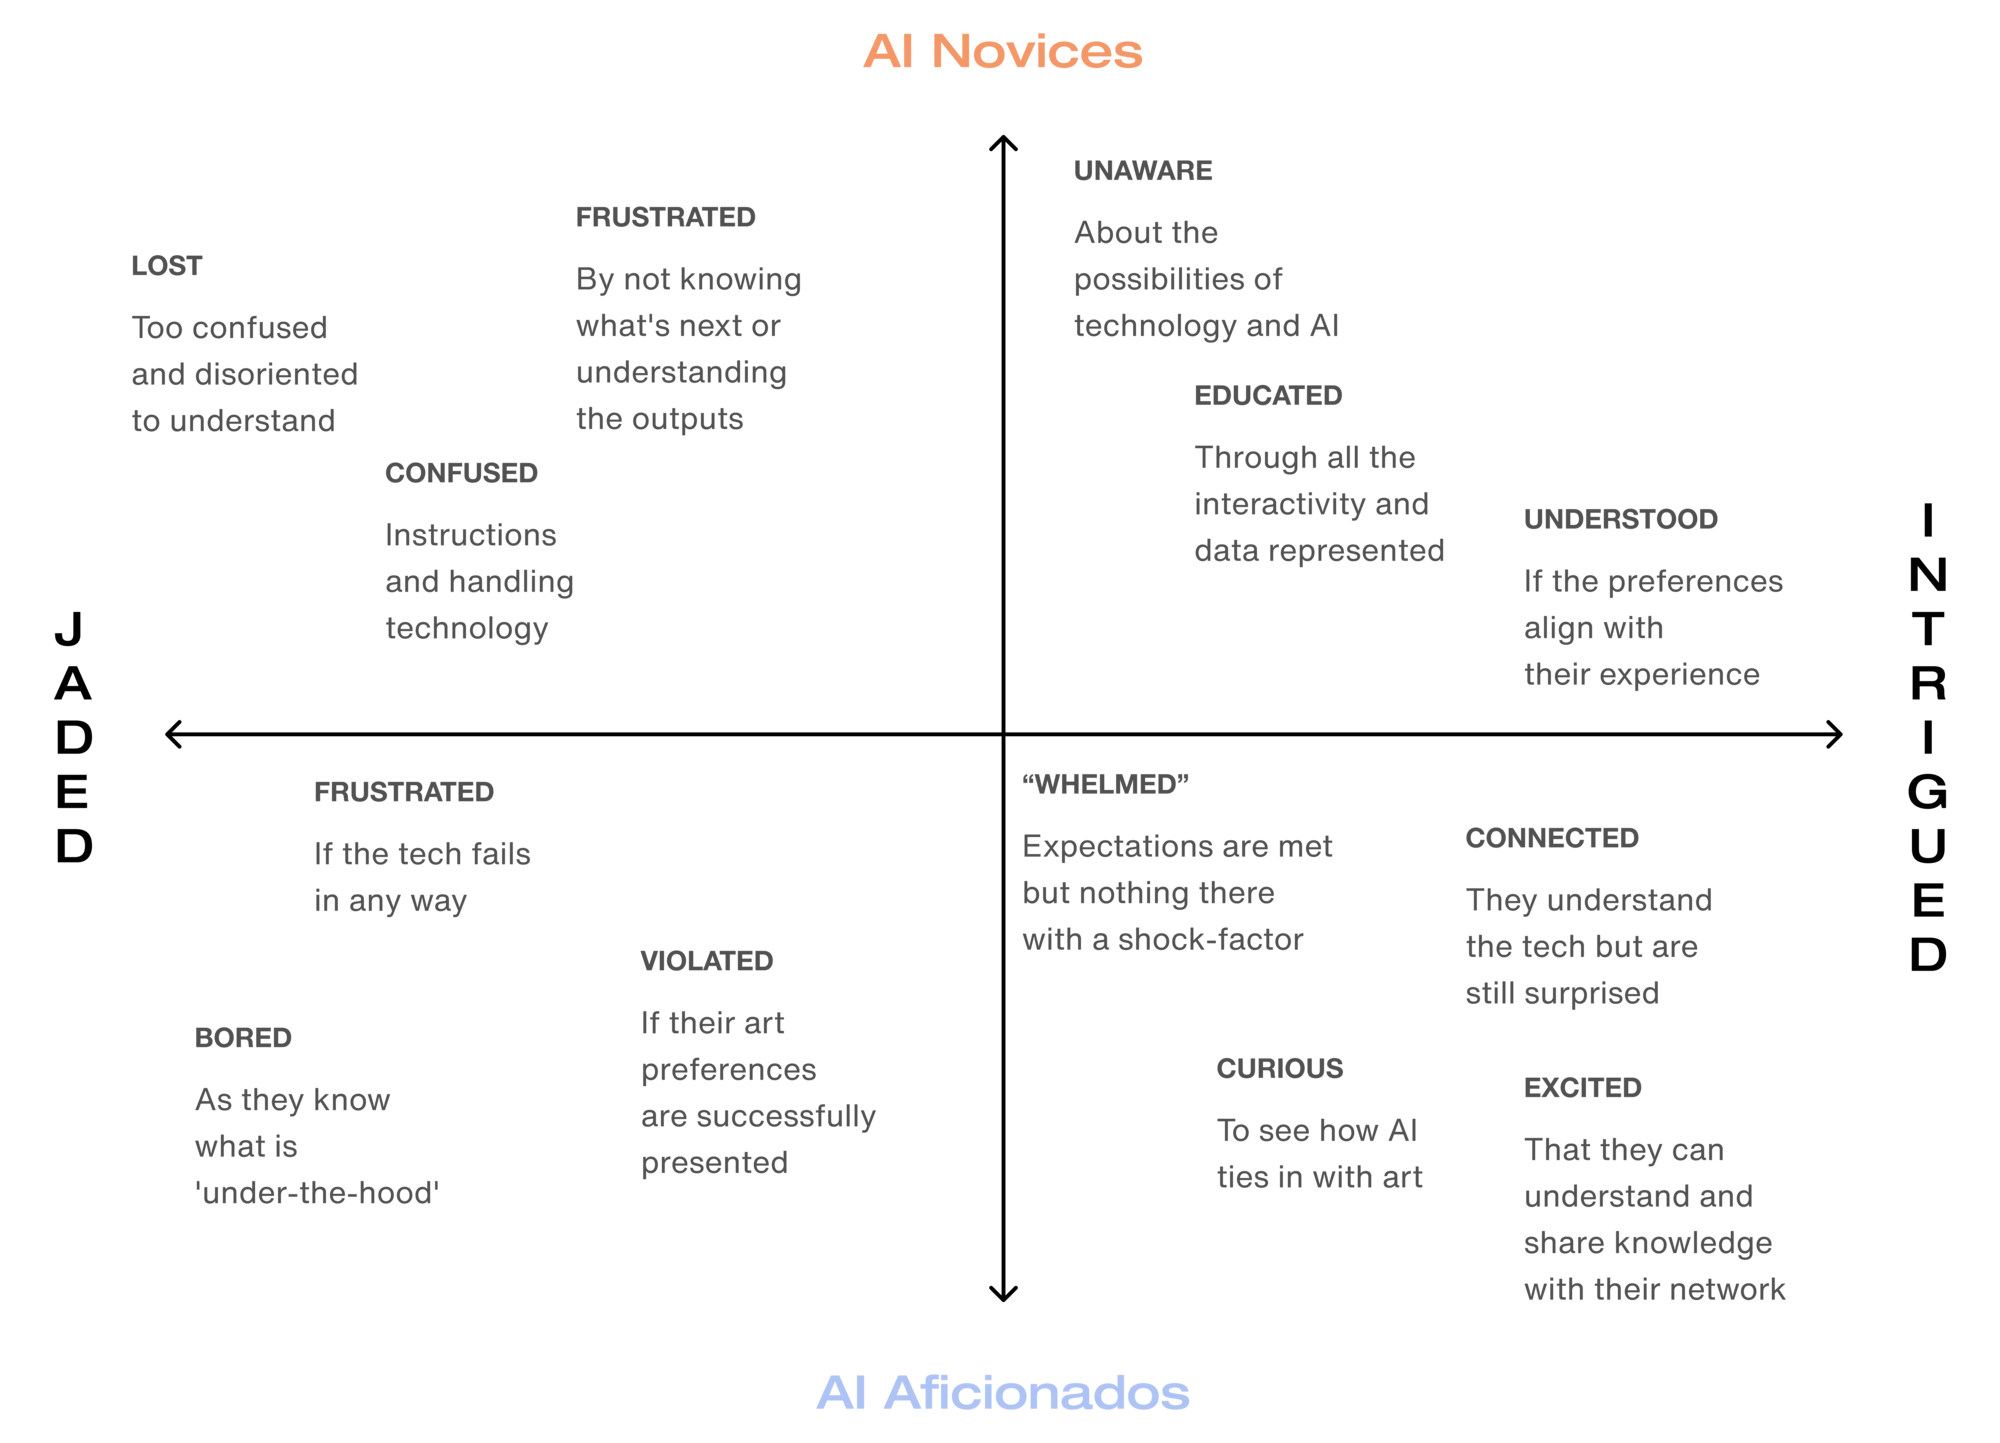
Audience spectrum matrix, plotting attitudes to AI across jagged to seamless and analog to digital
The audience spectrum, which is really where the whole piece came from. Four positions on AI plotted at once: jagged against seamless, analog against digital, from 'the user is in control' through to 'the AI is a companion'. The installation had to hold all of them at the same time.
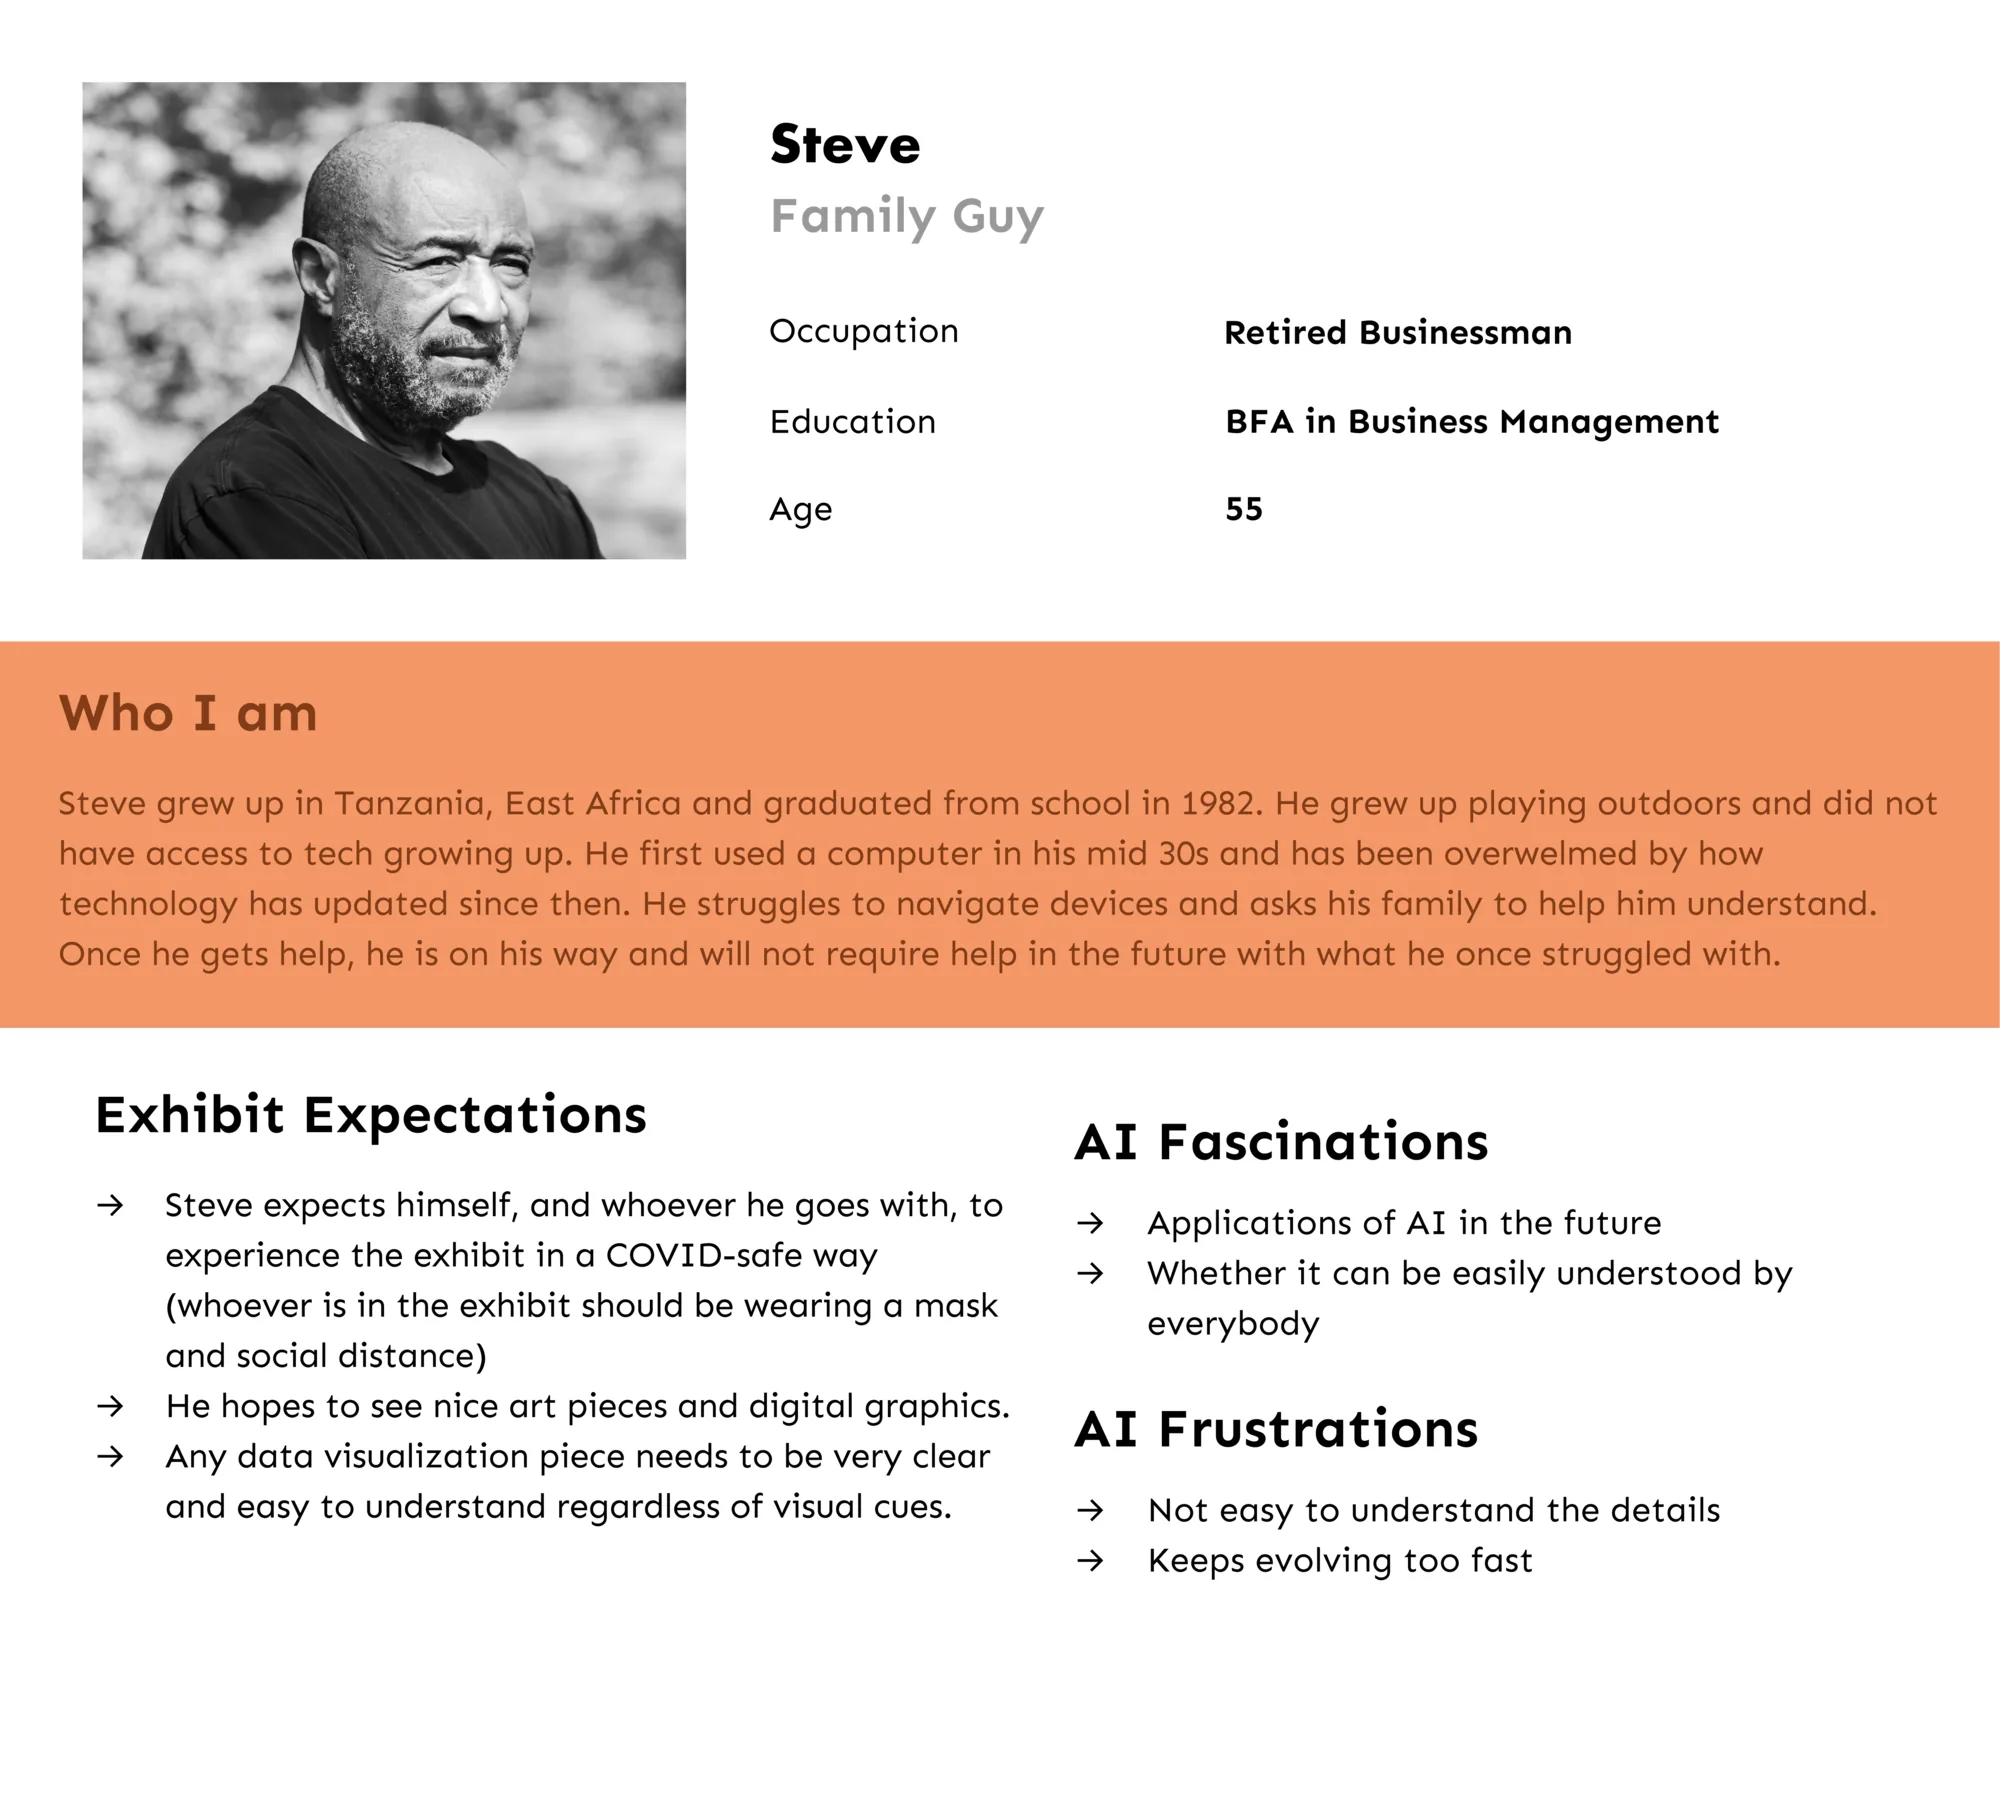
Persona: Steve, a retired builder of fifty-five
Steve, 55, retired builder. One end of that spectrum, and the person I kept coming back to while working out what the output should look like.
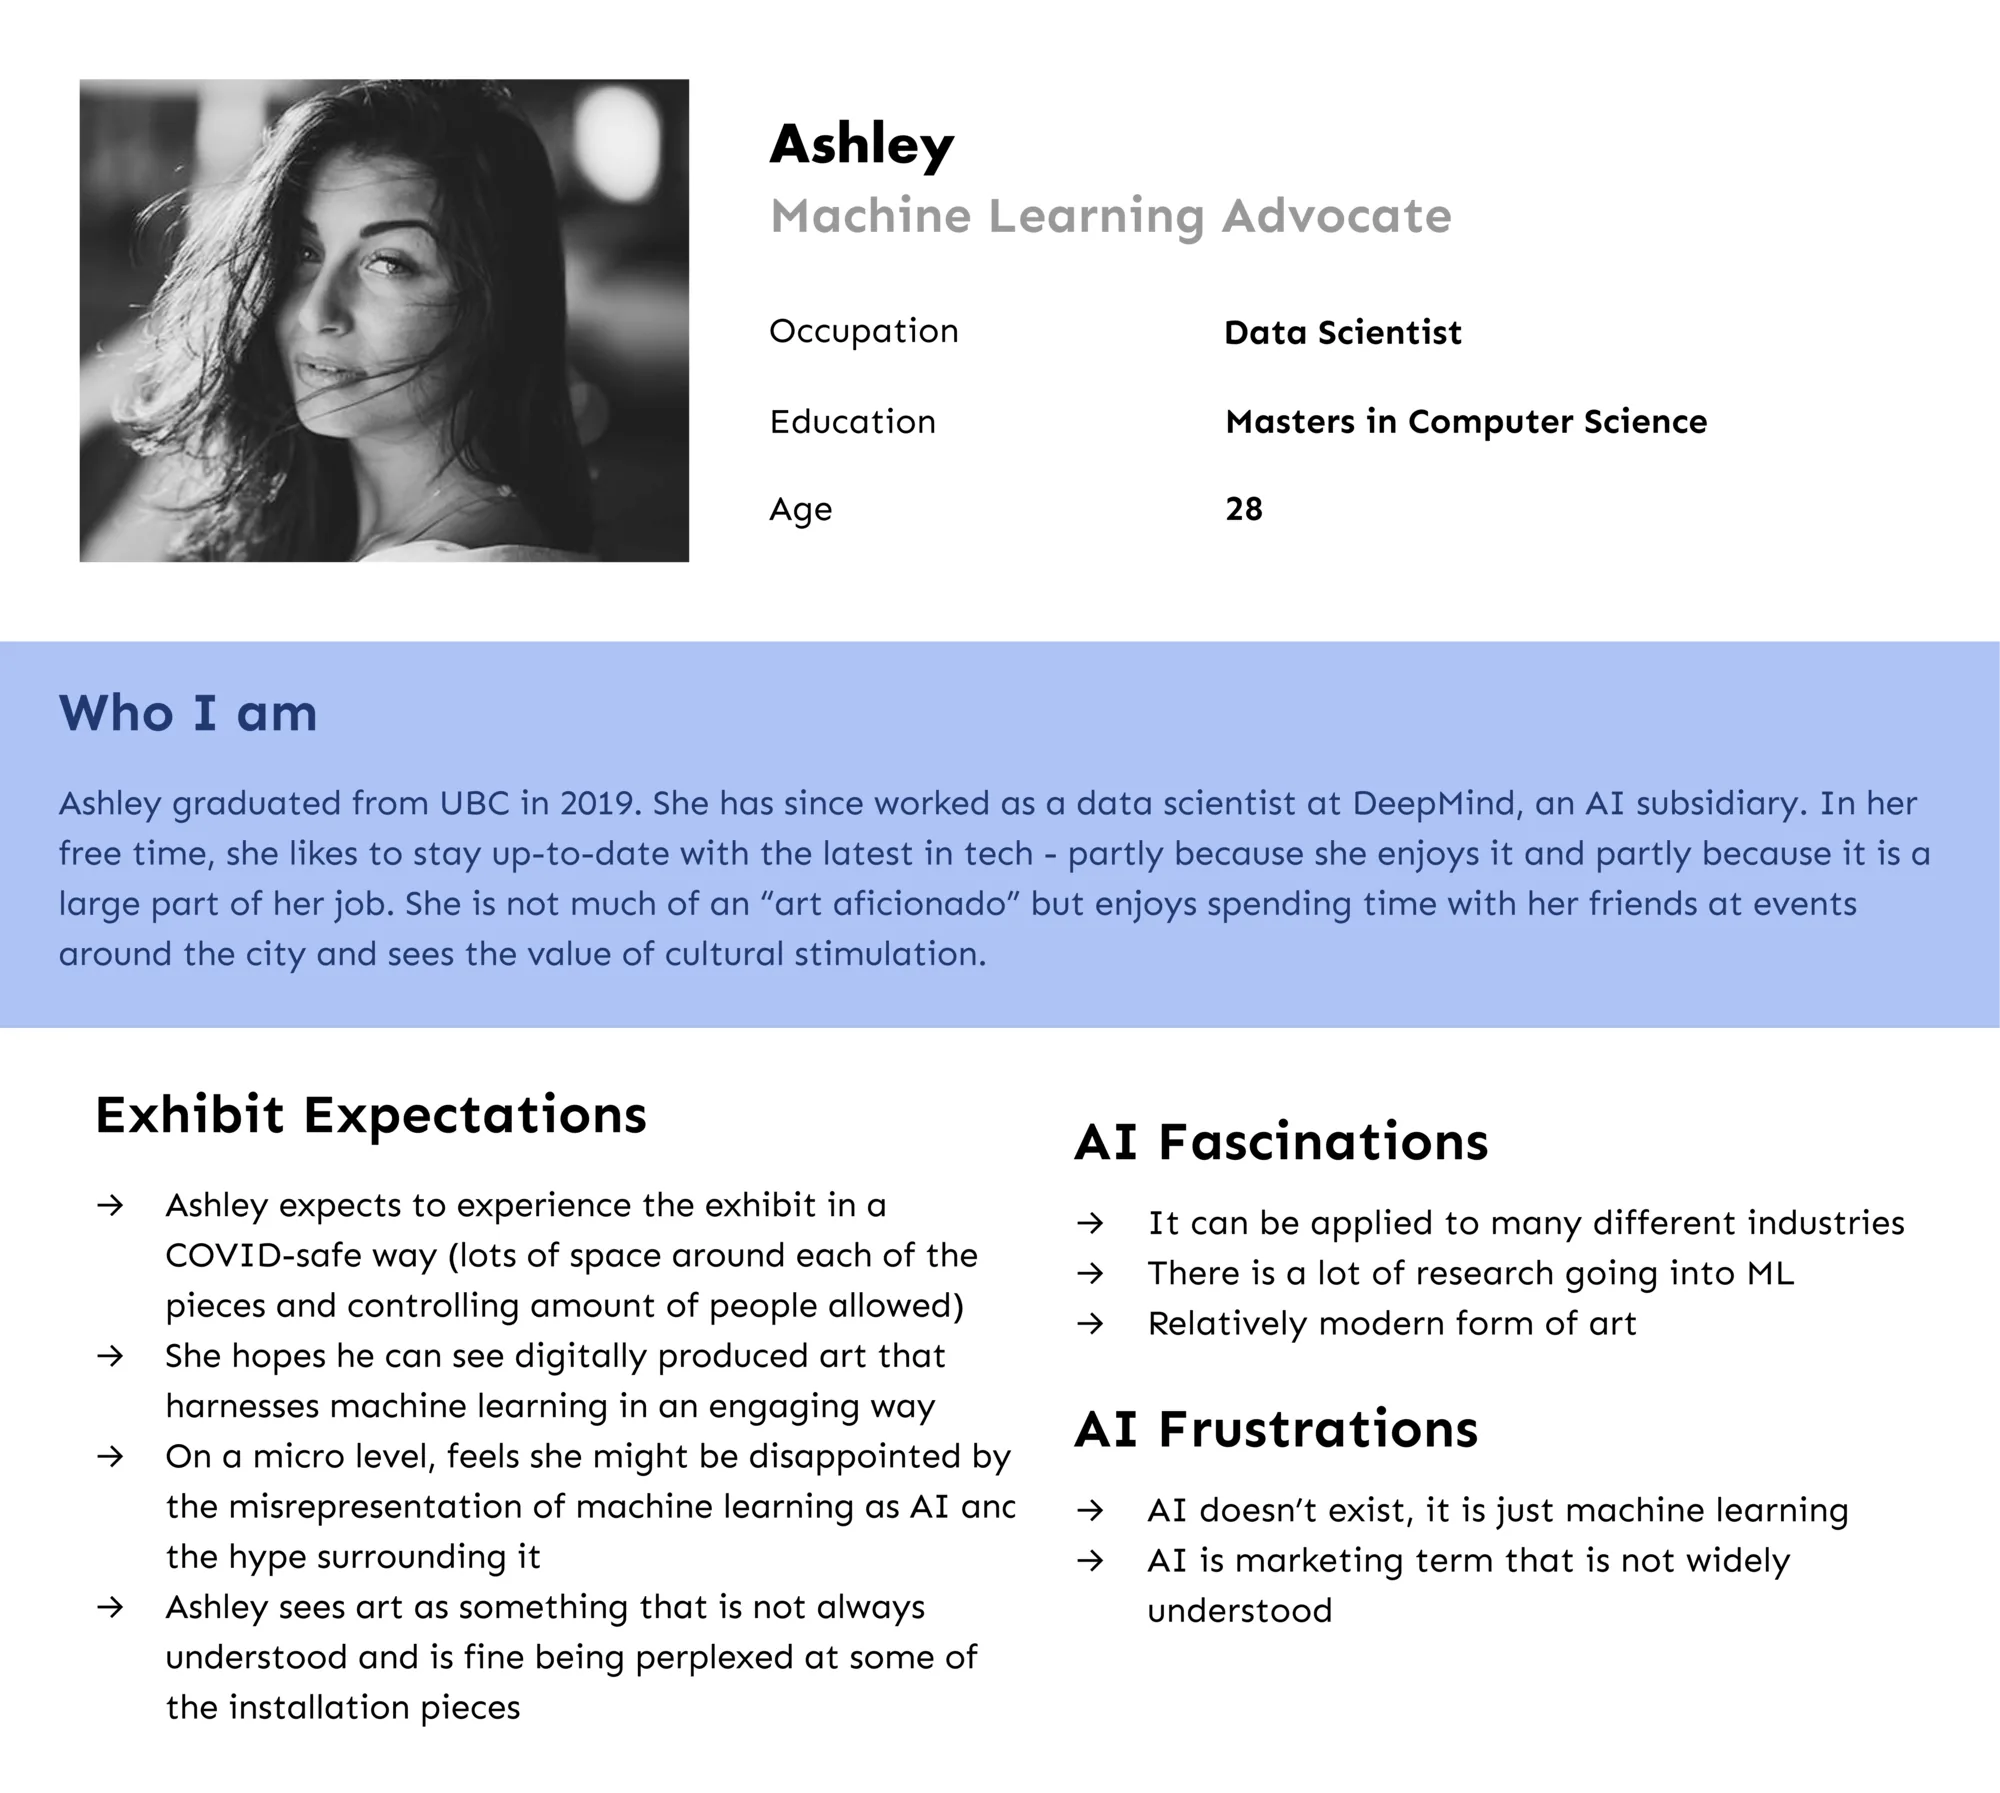
Persona: Ashley, a museum learning advocate with a data science background
Ashley, a museum learning advocate with a data science background. The other end of the spectrum, and the reminder that not everyone needs the piece explained to them.
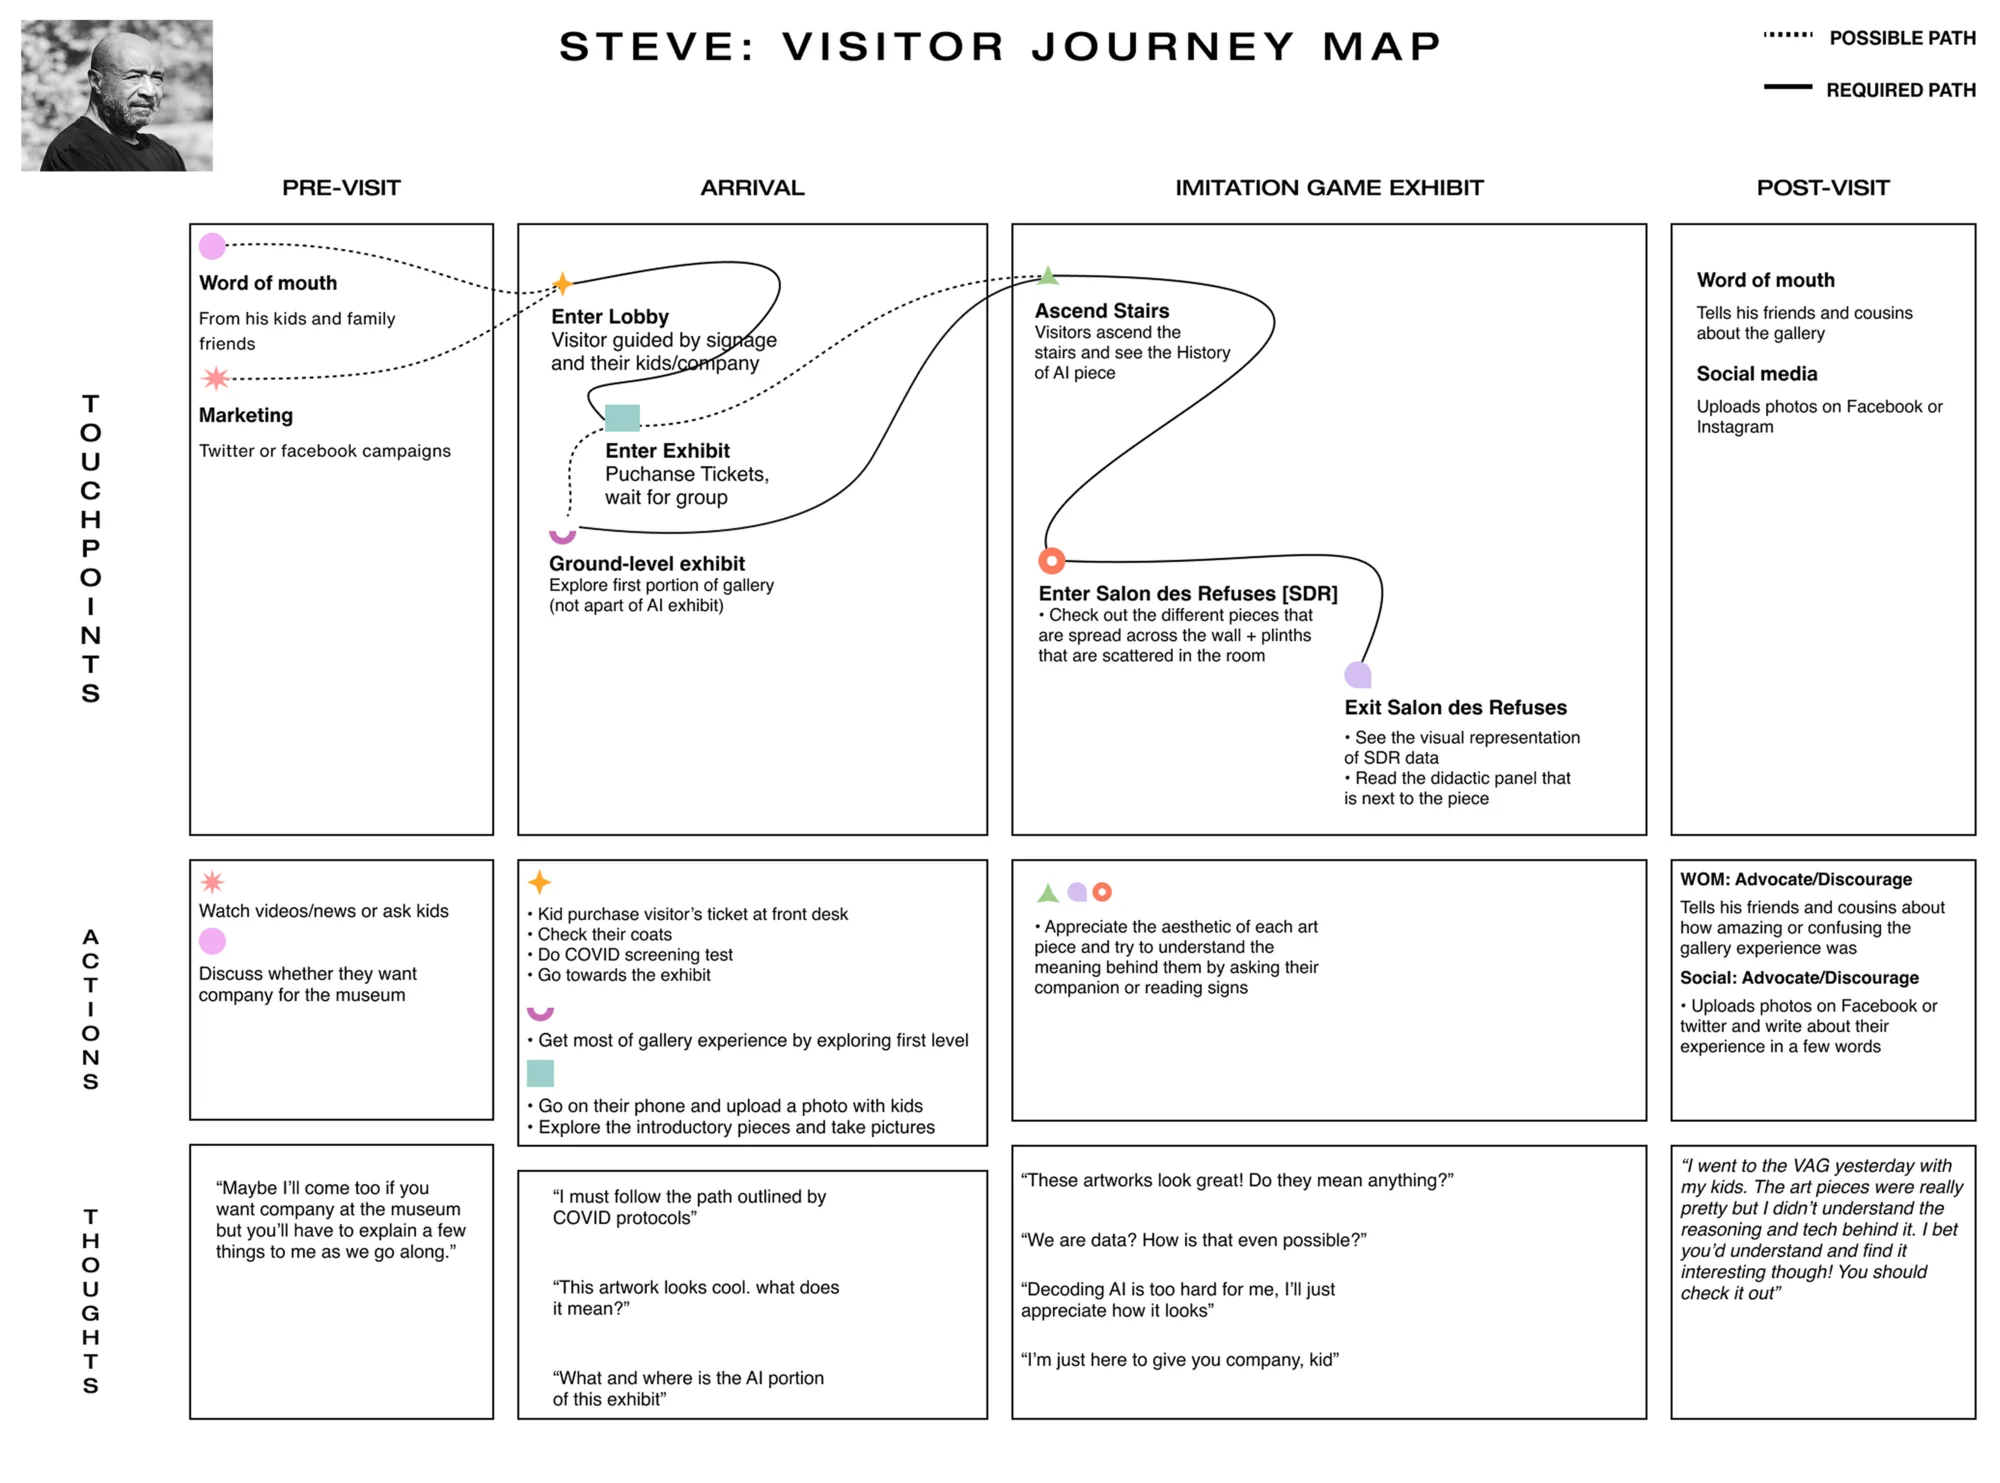
Steve's visitor journey map, from before the visit through arrival, the visit itself and afterwards
Steve's journey end to end: what he arrives wanting, what he does, how he feels at each point, where it goes wrong, and the opportunities that answer each of those.
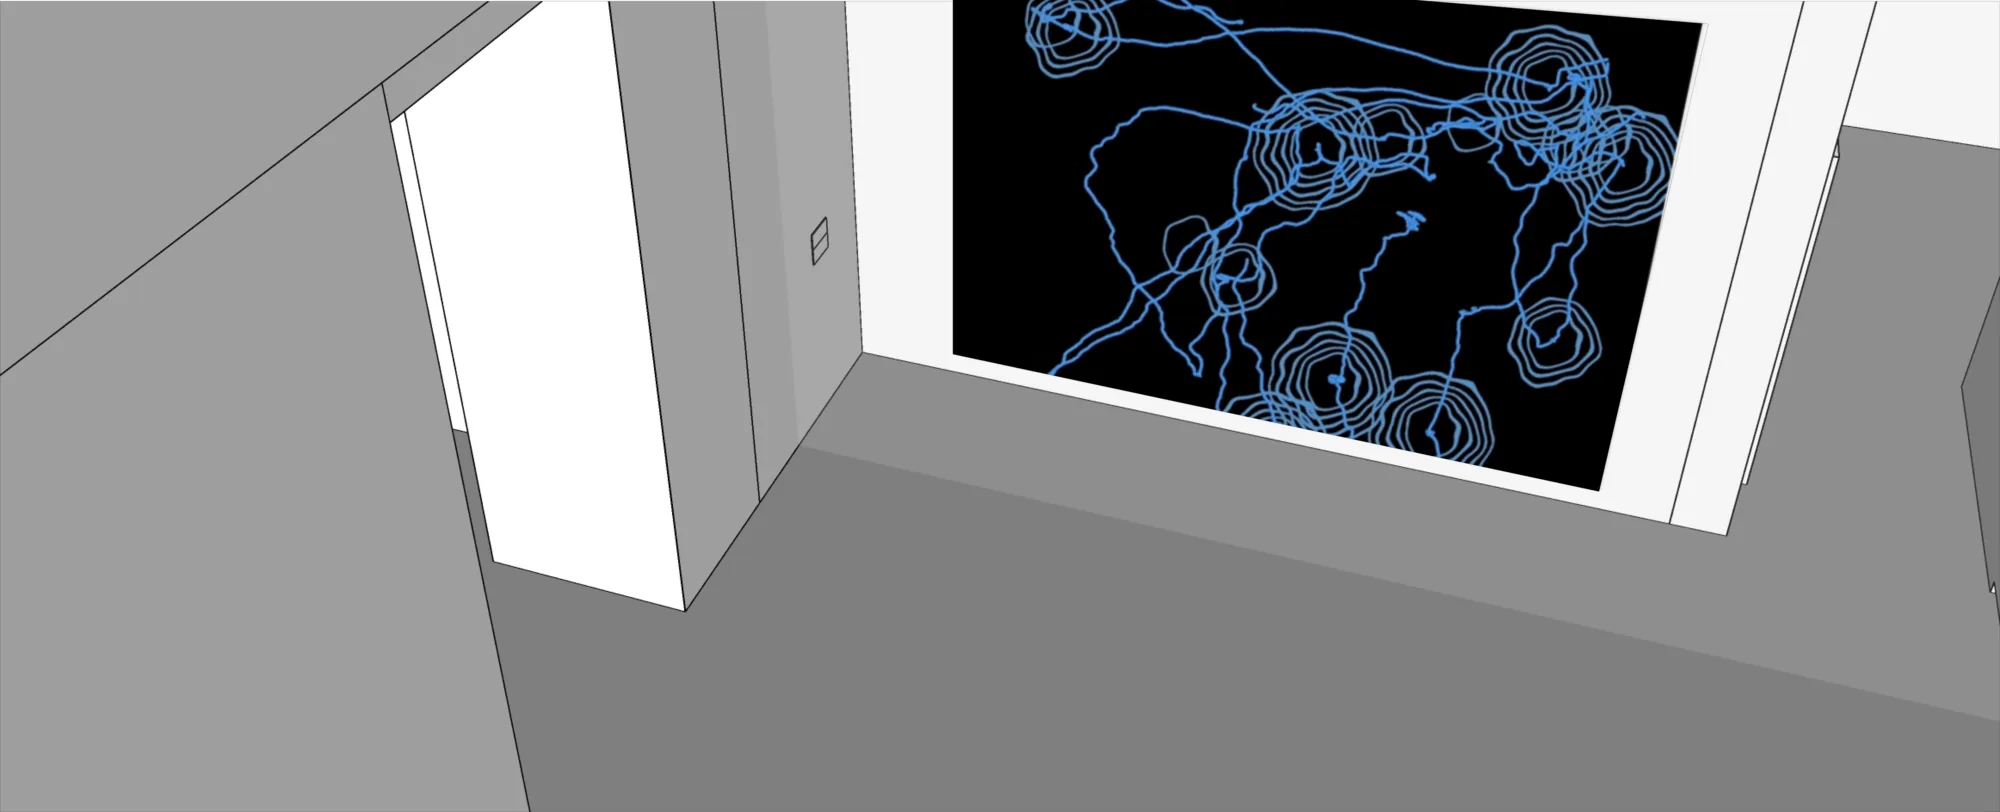
An early test of the line itself: how it should sit on the room's surfaces, before I worried about the data behind it.
And an early test of the radiating form, one of the directions I tried for what the line does when somebody stops moving.
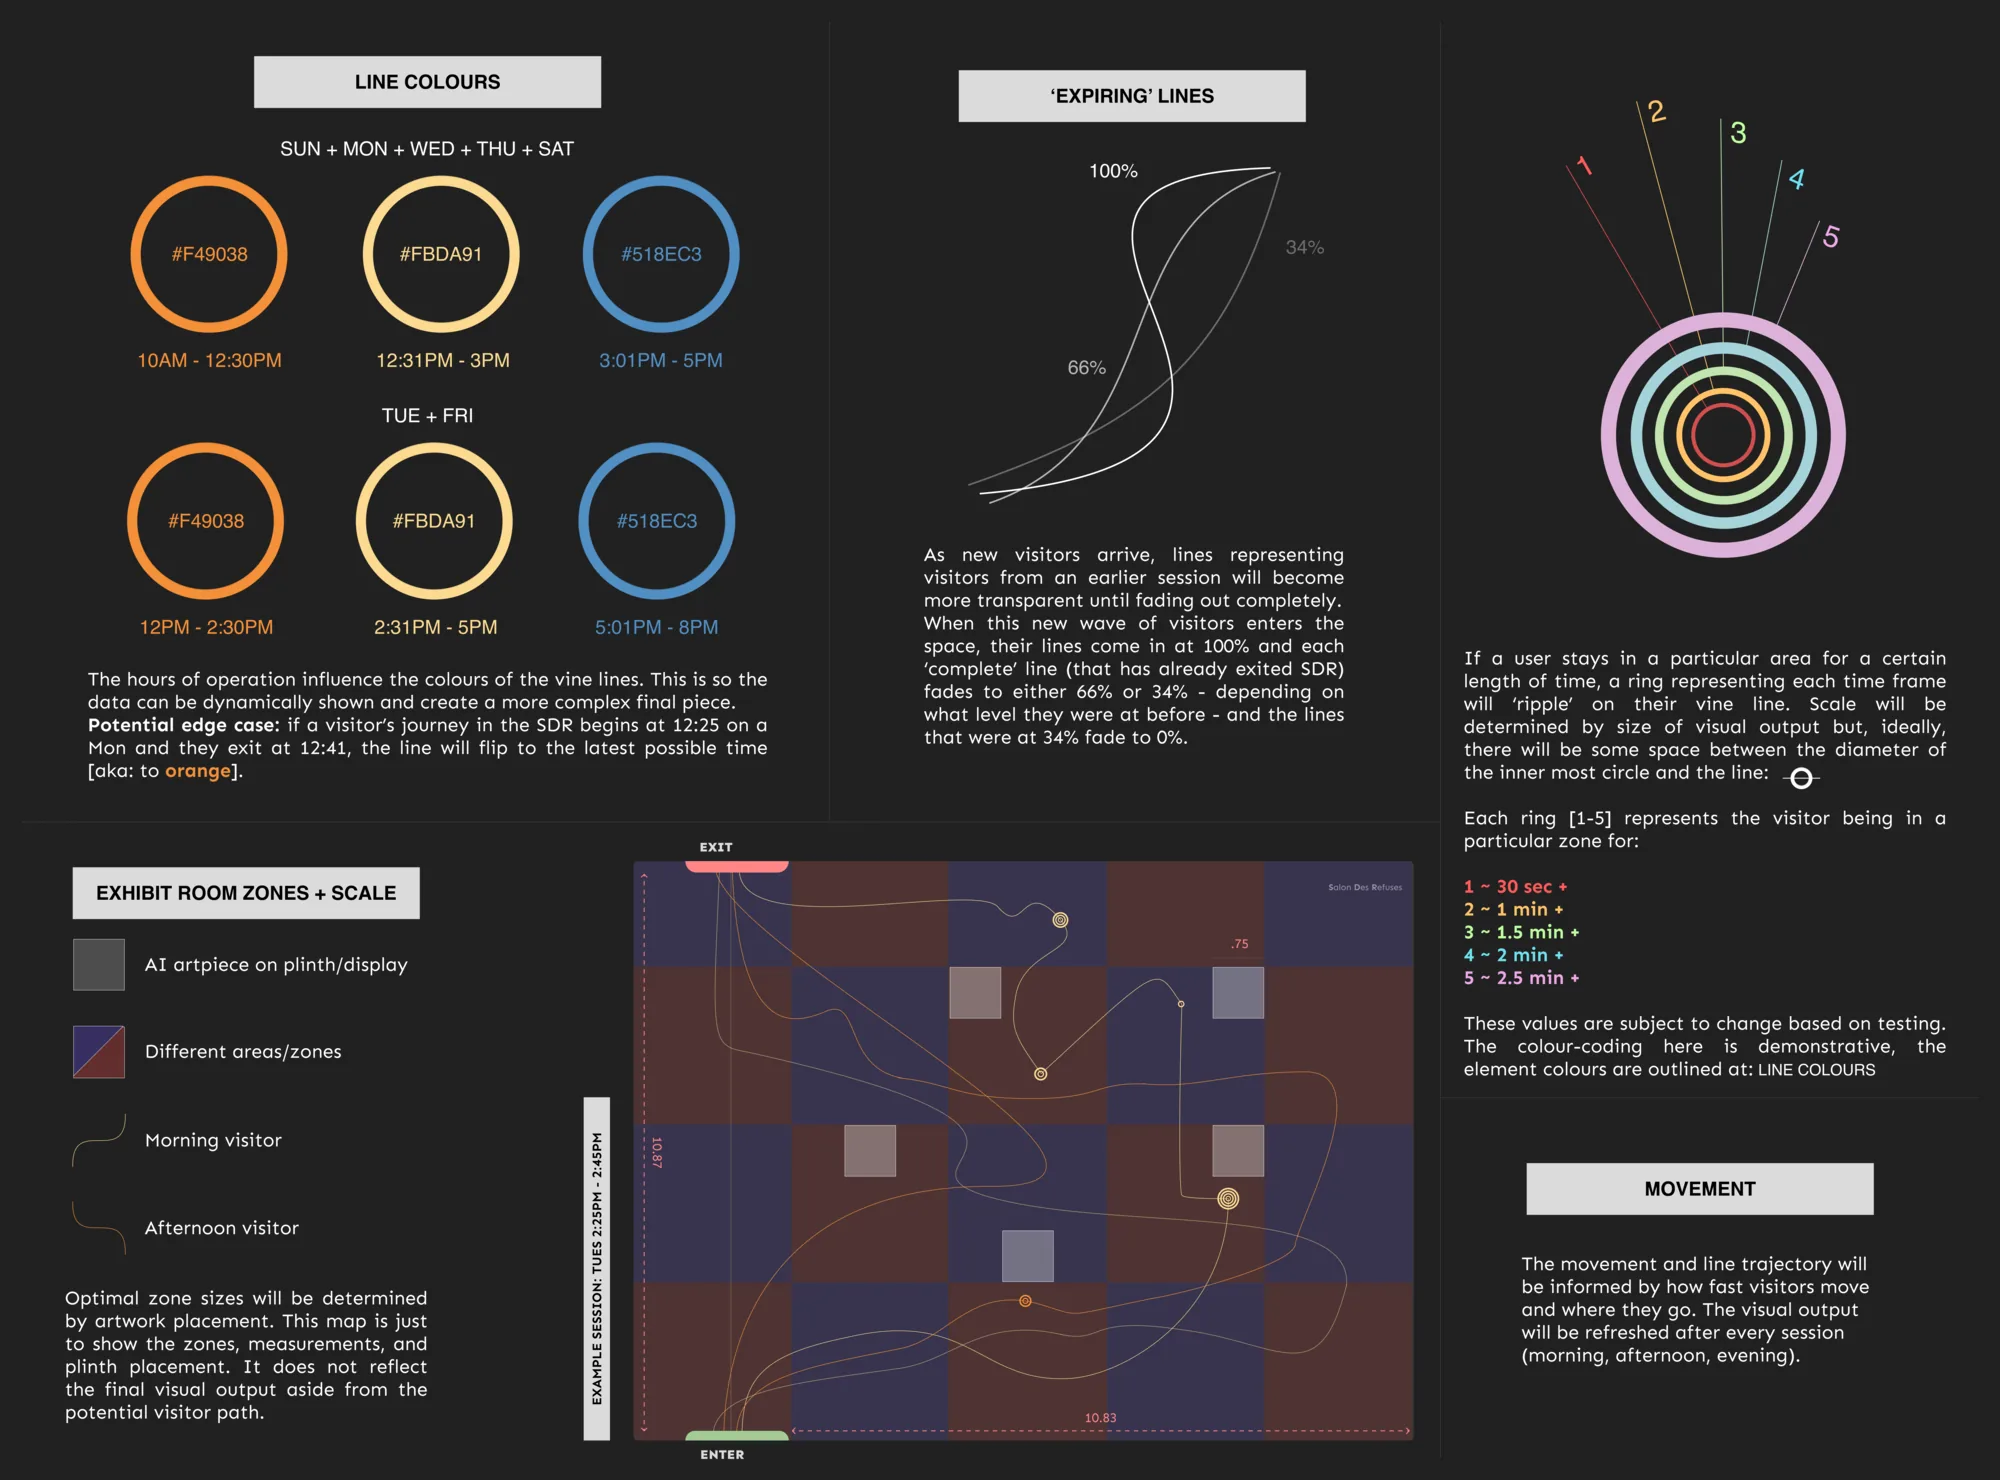
Design system board: line colours by hour of the day, dwell-time rings, and the logic for expiring lines
The rules, written down before anything was built. The line was a vine rather than a graph, so it grew: colour was set by the hour of the day, dwell time rippled out along it as rings, and lines expired, fading to 66%, then 34%, then out altogether as each session's visitors left.
Close-up of the installation plan, showing the zones, measurements and plinth placement
A close-up of the room plan: the zone the piece draws into, the measurements, and where the plinths sit.
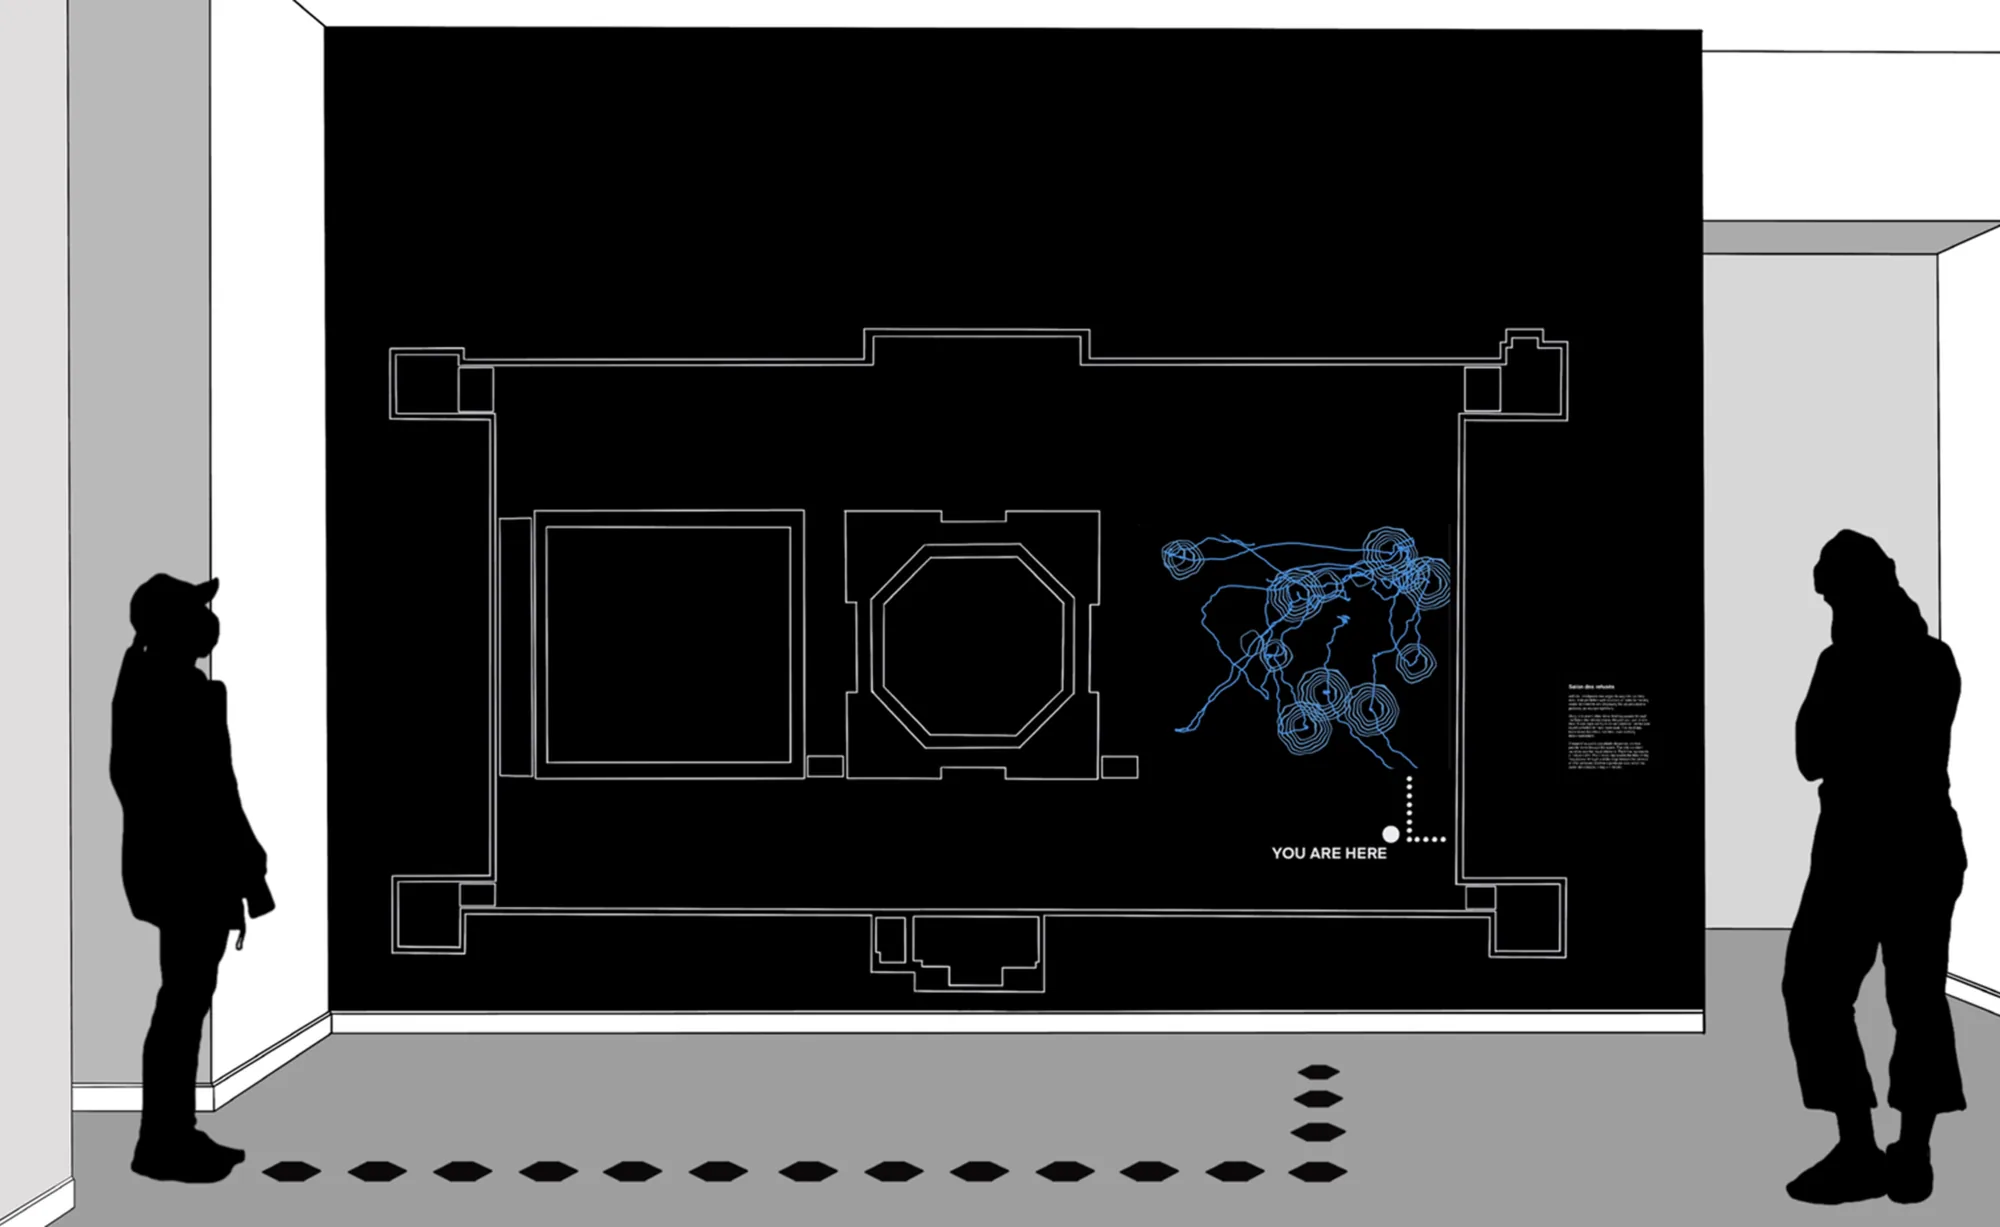
The installation mocked up on the gallery wall
The wall as we proposed it, mocked up in the space. One screen, one line drawing, and a room dark enough to let it carry.
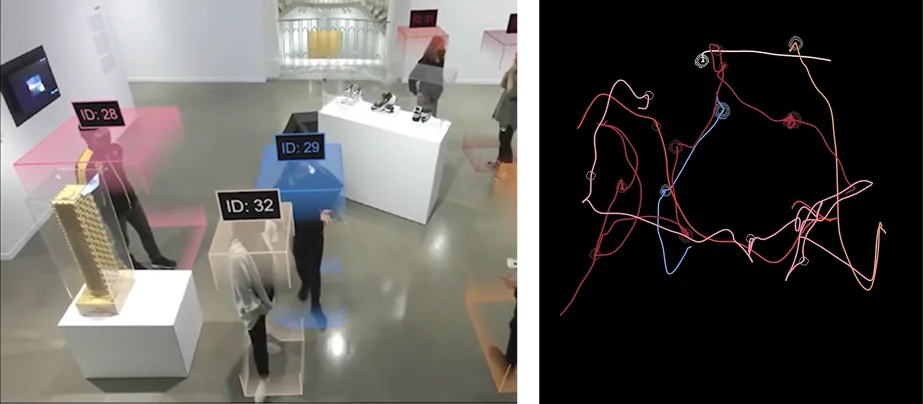
What the piece actually saw. Every visitor detected, boxed, numbered and given a colour. The number and the colour are all anybody becomes.
And the same session drawn: paths that cross, loop back and double up over themselves the way people actually move.
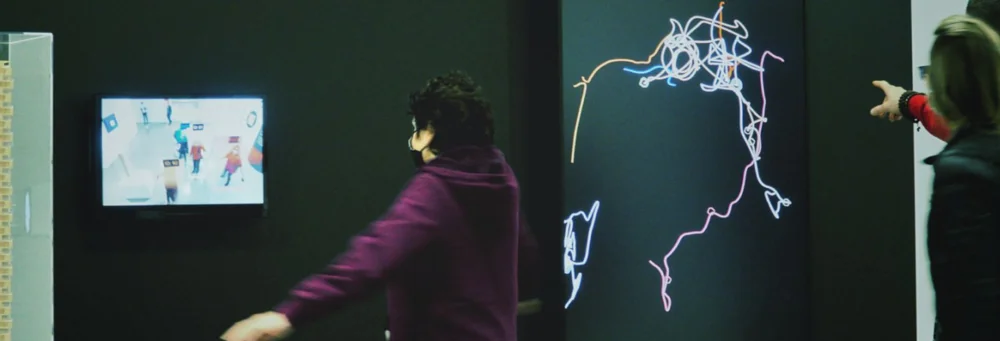
The gallery space and the paths recorded in it, shown side by side
The room and its record, side by side: visitors at the wall, and the drawing the piece made out of them.
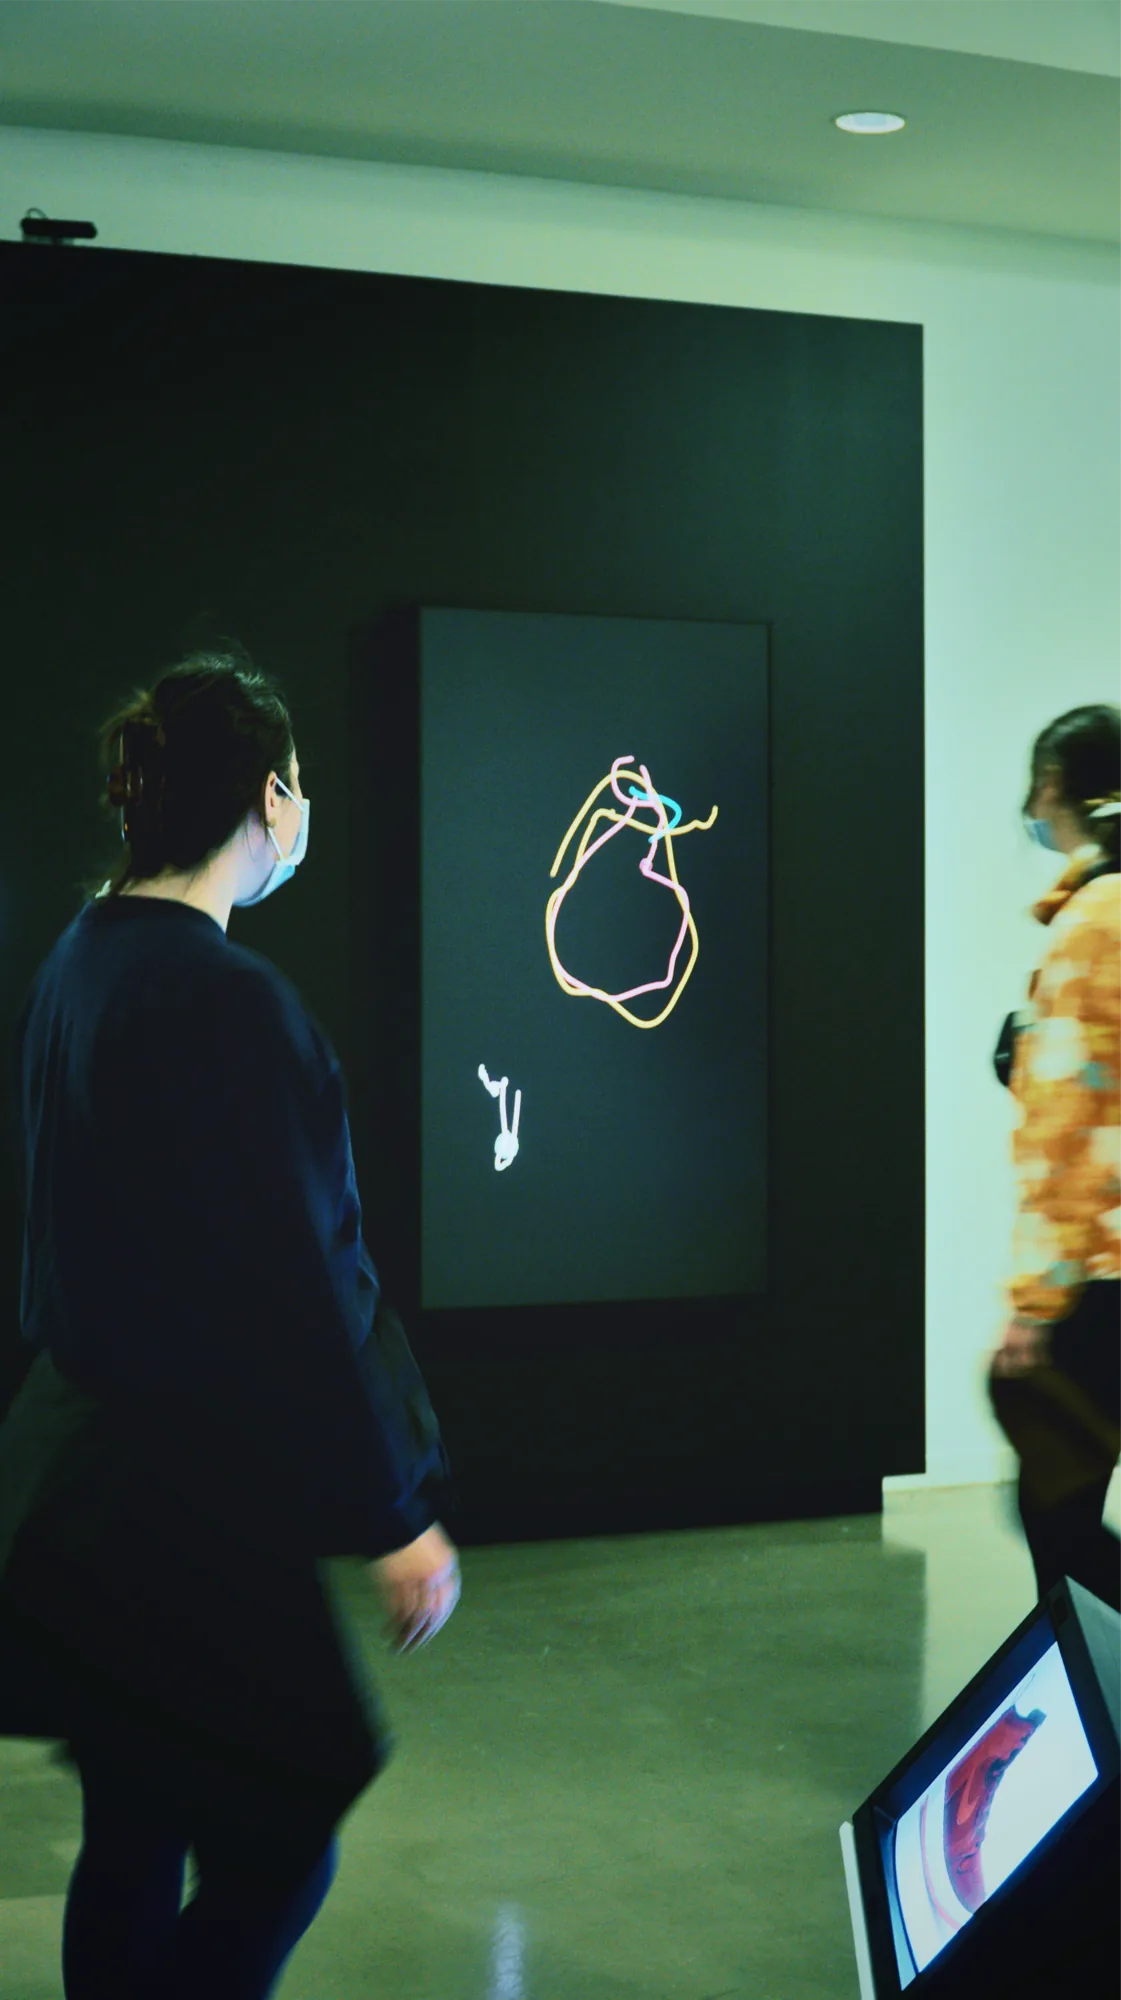
A visitor watching the installation in the gallery
In the gallery: a visitor watching the drawing build.
Visitors in the exhibition space, each already carrying an id and a colour
The room in use. By the time anyone reaches the wall they are already an id and a colour.